Graph Pop-Up Menu
A pop-up menu is available in the Data Settings and Properties to let you access the Measurement Inspector, manage scalar information, as well as to export graphs and execute macros. You should note that the items available in the pop-menu are dependent on the number of items selected — one or multiple.
The following items are available when you select a single graph in the Data Properties and Settings panel.
Current Bounding Box… Automatically creates a box that corresponds to the dimensions of the bounding box of the selected graph. If required, you can edit the geometry of the box.
Current Clip Box… Automatically creates a box that corresponds to the dimensions of the clip box associated with the selected graph. If required, you can edit the geometry of the box.
As ORSObject… Lets you save the selected graph in the ORSObject (*.ORSObject extension) file format (see Exporting Objects).
Opens the Measurement Inspector panel (see Evaluating Graphs with the Measurement Inspector).
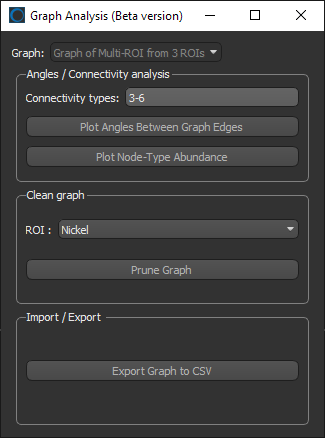
Opens the Graph Analysis dialog, shown below, in which you can conduct a detailed analysis of a selected graph, such as plotting angles between graph edges or computing node-type abundance.
Graph Analysis tool
Provides a shortcut for selecting macros that can be executed for the selected graph (see Recording and Playing Macros).
Opens the Object Description dialog, in which you can add a description to the selected object or edit its current description (see Managing User Data).
Lets you delete selected edge and vertex scalar values (see Deleting Scalar Values from Graphs).
Lets you import edge or vertex scalar values contained in a selected comma-separated values (*.csv extension) file (see Importing Scalar Values from CSV Files to Graphs).
Lets you map vertex scalar values contained within another object (see Mapping Vertex Scalar Values to Graphs).
Plots the distribution of graph tortuosity between input and output boxes (see Plotting Graph Tortuosity).
Note This item will only be available if the required box shapes are available in the Data Properties and Settings panel.
Lets you graph throat-weighted tortuosity between selected input and output boxes (see Tortuosity Analysis).
Lets you graph tortuosity between selected input and output boxes (see Tortuosity Analysis).
Plots the distribution of graph tortuosity and throat-weighted tortuosity between input and output boxes (see Plotting Graph Tortuosity).
Note This item will only be available if the required box shapes are available in the Data Properties and Settings panel.
Creates a region of interest that is representative of the selected graph.
Lets you add a constant vertex measurement to the selected graph (see Adding Constant Edge and Vertex Measurements).
Lets you add a constant vertex measurement to the selected graph (see Adding Constant Edge and Vertex Measurements).
Lets you add vertex connectivities measurements to the selected graph, which provides an opportunity to investigate the connectivity of the graph nodes.
Lets you apply linear transformations to the selected scalar value(s) by modifying the slope and/or offset values.
Automatically computes and adds scalar values of distances calculated from the mean position of a series of points.
Note You must first create a points series with the Point tool to enable this item.
Automatically computes the Euler characteristic number that describes the surface of the selected graph.
Lets you add measurements of Euclidean length to the edges of a graph.
Lets you assign a new unit to scalar values. In this case, the default unit of the stored scalar values will be changed, but the scalar values will be kept as is. For example, if the scalar value stored is 0.75 meters and the unit assigned to length is centimeters, then the scalar value shown would be equivalent to 0.0075 meters. You should note that the default units of lengths, areas, and volumes is meters, while the default unit of angles is radians. Discrete and continuous values are not stored with units.
The following example illustrates how assigning a unit to scalar values is implemented. You should note that measurements will always appear in the units selected for the scene views.
| Measurement shown (length): | 3.75 cm |
| Scalar value stored: | 0.0375 m |
| Value shown when assigned unit to length is mm: | 0.00375 cm |
| Value shown when assigned unit to length is dm: | 0.375 cm |
| Value shown when assigned unit to length is discrete: | 0.0375 |
- Right-click the graph and then choose Assign Unit to Scalar Values in the pop-up menu.
The Choose a Scalar Values Slot dialog appears.
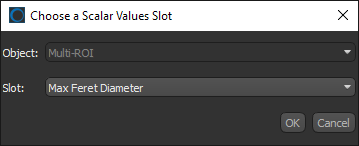
- Choose the scalar value slot that you want to assign a unit to in the Slot drop-down menu and then click OK.
The Choose Unit Type dialog appears.
- Choose a unit type in the Choose Unit Type dialog, as shown below.
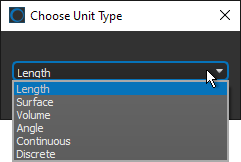
- Click OK.
- Choose a unit in the Choose Unit dialog, as shown below.
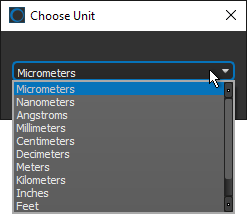
This is the unit that will be applied to the stored scalar value.
- Click OK.
The selected scalar value slot is updated.
Extracts the object's history as a macro, which can provide an audit trail to help troubleshoot processing issues (see Extracting Object Histories).
Note Object history macros can also be edited and replayed to create new objects.
The following items are available whenever you select two or more graphs in the Data Properties and Settings panel.
As Multiple ORSObject… Exports the selected items in the ORS Object (*.ORSObject extension) file format to a selected folder as multiple files (see Exporting Objects). You should note that if the selected objects share the same name, their file names will be appended with a sequential number.
As ORSObject… Exports the selected items to an ORS Object file (*.ORSObject extension) to a selected folder (see Exporting Objects).
Provides a shortcut for selecting macros that can be executed for the number and type of items selected.


